- Measuring Growth
- Reports
- Additional Resources
- Admin Help
- General Help
Teacher Value-Added
Interpreting the Data
Teacher reports categorize teacher growth measures using a two-step process based on the growth index and the effect size. For an explanation of how EVAAS categorizes teacher growth measures, see the Levels section of Technical Details.
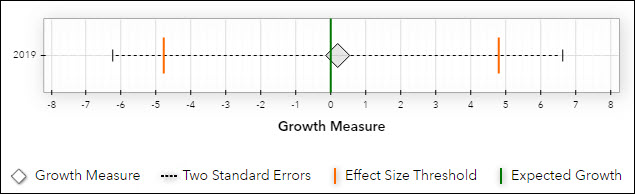
In this graph, each growth measure is marked with a diamond. This value represents the amount of academic growth the teacher's students made in this grade and subject or course. On either side of the growth measure, you'll see a mark for two standard errors above and below the growth measure. These marks create a confidence band around the growth measure. The expected growth is represented by the green line. The orange lines represent the effect size threshold. This threshold denotes the amount of growth needed to obtain an effect size of -0.4 and 0.4.
Level 4
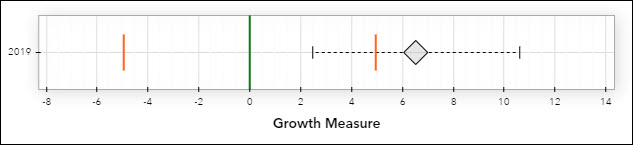
If the teacher's growth measure is Level 4, there is significant evidence that the teacher's students made more progress than expected growth. The Index is greater than or equal to 2 because the standard error whisker is completely to the right of the green line. The effect size is greater than or equal to 0.4 because the growth measure diamond is to the right of the positive effect size threshold.
Level 3
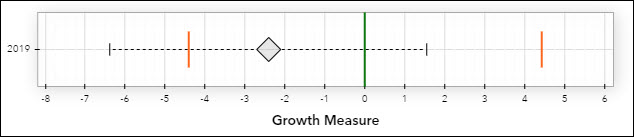
The teacher's students made progress similar to expected growth. The index is greater than or equal to -2 because the standard error whisker never moves completely to the left of the green line. The effect size is less than 0.4 because the growth measure diamond is to the left of the positive effect size threshold.
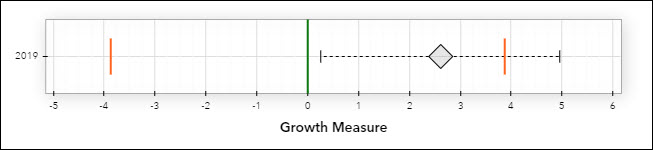
Level 2
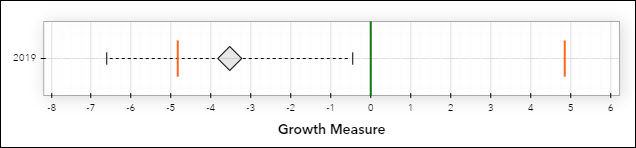
There is evidence that the teacher's students made less progress than expected growth. The index is greater than or equal to -2 because the standard error whisker is completely to the left of the green line. The effect size is greater than or equal to -0.4 because the growth measure diamond is to the right of the negative effect size threshold.
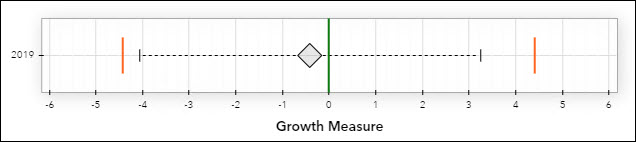
Level 1
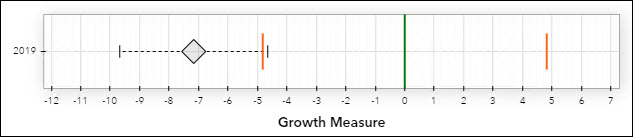
There is significant evidence that the teacher's students made less progress than expected growth. The index is less than -2 because the standard error whisker is completely to the left of the green line. The effect size is less than -0.4 because the growth measure diamond is to the left of the negative effect size threshold.
View the diagnostic reports in conjunction with the value-added reports. While the value-added reports provide overall measures of average growth for the entire group of students, the diagnostic reports reveal whether students at different achievement levels might have made more, or less, academic growth than the group's average.