- Measuring Growth
- Reports
- Additional Resources
- Admin Help
- General Help
Reporting FAQs
What is a value-added or growth model?
Value-added models measure the academic growth rates of groups of students from one point in time to another compared to expected growth. A group could be all the students in a particular district, school, or teacher's class in a specific subject, grade, and year. The expected growth is based on how the individual students within the group performed, on average, compared to other students just like them across the state. A value-added model then compares a group's actual growth to the expected growth.
What type of growth model does EVAAS use?
EVAAS reports use a gain model, which measures the change in achievement as student cohorts take tests in the same subject in consecutive years. Multiple subjects and grades are analyzed simultaneously to provide the most reliable estimates of students' entering and exiting achievement over the course of a year. The gain model is used for:
- M-STEP Mathematics and English Language Arts in grades 4-7
- PSAT 8/9 Mathematics and English Language Arts in grade 8
- MAP Mathematics and Reading in grades 1-8 (Teacher reports only)
- STAR Mathematics grades 2-8 and Reading & Literacy K-8 (Teacher reports only)
- i-Ready Mathematics and ELA grades K-8 (Teacher reports only)
EVAAS reports use a predictive model, where each student receives an expected score based on their prior achievement and the expected growth. The growth measure reported for a district, school, or teacher is a function of the difference between the entering achievement for included students and the students' exiting achievement. The predictive model is used for:
- M-STEP Social Studies in grades 5, 8, and 11
- M-STEP Science grades 5, 8, and 11
- PSAT 8/9 grade 9 Mathematics and Evidence-Based Reading and Writing
- PSAT 10 Mathematics and Evidence-Based Reading and Writing
- SAT Mathematics and Evidence-Based Reading and Writing
In both models, the growth measure indicates whether students' achievement increases, decreases, or stays about the same over time. The Michigan Department of Education recommends the use of gain model reports to measure state assessment student growth within educator evaluations.
What is the difference between growth and proficiency?
Proficiency is captured by a test score at a single point in time. Growth is the change in achievement over two or more time points, and EVAAS determines growth by comparing student assessment scores.
What does it mean to meet the expected growth?
In the value-added models, expected growth generally means that the average achievement for a group of students has stayed the same over time. The precise definition varies by model.
In the gain model, expected growth means that students maintained the same relative position with respect to the in the state student achievement from one year to the next in the same subject area. More specifically, the gain modelis reported in NCE units, an equal-interval scale similar to percentiles. For example, if the average achievement in a school was at the 50th NCE in 2017 grade 4 math, based on the 2017 grade 4 Math in the state distribution of student achievement, and their achievement is at the 50th NCE in 2018 grade 5 Math, based on the 2018 grade 5 Math in the state distribution of student achievement, then the school growth measure is 0.0 NCEs. This means that the school's students have maintained their achievement level and met expected growth.
In the predictive model, expected growth means that students' exiting scores met their expected scores for the assessment in question, and this expectation is based on the average observed growth statewide. For example, the predictive model measures whether students allocated to a school made the same observed growth statewide as students in the average school in the state for that same year/subject/grade.
Which tests does EVAAS use?
The Michigan Department of Education provides results for state administered assessments to EVAAS for use in value-added analyses. EVAAS uses data from these assessments to generate value-added reports for districts, schools, or teachers.
Gain Model
EVAAS uses this approach to generate growth measures for these assessments:
- M-STEP Mathematics and English Language Arts in grades 4-7
- PSAT 8/9 Mathematics and English Language Arts in grade 8
- MAP Mathematics and Reading in grades 1-8 (Teacher reports only)
- STAR Mathematics grades 2-8 and Reading & Literacy K-8 (Teacher reports only)
- i-Ready Mathematics and ELA grades K-8 (Teacher reports only)
Predictive Model
This model is used to provide reports for these assessments:
- M-STEP Social Studies in grades 5, 8, and 11
- M-STEP Science grades 5, 8, and 11
- PSAT 8/9 grade 9 Mathematics and Evidence-Based Reading and Writing
- PSAT 10 Mathematics and Evidence-Based Reading and Writing
- SAT Mathematics and Evidence-Based Reading and Writing
Is it more difficult for high-achieving students to show growth?
Educators serving high-achieving students are often concerned that their students' entering achievement level makes it more difficult for them to show growth. However, with EVAAS, educators are neither advantaged nor disadvantaged by the type of students they serve.
As long as the assessments that are administered are able to measure differences in achievement among very high-achieving students, then it is possible to measure the growth of those students reliably using EVAAS. All assessments used in the value-added analyses have sufficient stretch at both the very low and very high ends of the achievement range to be used this way.
As a result, EVAAS is fair not only to districts, schools, or teachers serving high-achieving students but it is also fair to the students themselves. The modeling that underlies EVAAS considers the progress of all students regardless of their entering achievement, and the reporting shows whether the curriculum and instruction appropriately target these students' academic needs. High-achieving students might require enrichment work in the same way that low-achieving students might need remediation to make sufficient progress.
How does EVAAS categorize growth measures for a district, school, or teacher?
The growth measure represents the average growth of all students used in the analysis for the district, school, or teacher. However, this growth measure can be combined with other statistical metrics to assist with interpreting the growth measure. District and school growth measures are categorized using their associated standard error. Teacher growth measures are categorized through a two-step process using both their standard error and the student-level standard deviation of growth.
The standard error provides a measure of certainty and can be used to establish a confidence interval around the growth measure. Dividing the growth measure by the standard error provides an indicator of how strong the evidence is that the group of students met, exceeded, or fell short of expected growth. The standard error varies depending on how many students were included in the analysis for this district, school, or teacher and how complete the students' testing records were.
The standard deviation describes variability in the growth made by individual students within a given subject and grade. Dividing the growth measure by the standard deviation provides an indicator of magnitude and practical significance that the group of students met, exceeded, or fell short of expected growth. The practical significance is related to how large the growth measure is relative to the student level standard deviation in the given subject and grade.
The standard error and standard deviation protect educators from misclassification as they require statistical evidence and meaning, respectively, to categorize growth measures.
What is the difference between expected scores and projections?
Growth models, such as those based on assessments analyzed with the predictive model, measure how much growth has occurred compared to predicted expectations. Students have already taken the assessments in question. Conversely, projection models predict scores based on assessments that students have not yet taken. They proactively provide probabilities that a student will obtain a certain benchmark on a future test, and these probabilities are based on the student's prior test scores as well how students with a similar testing history in a previous cohort actually performed on the selected test.
While the underlying analytics are similar between the predictive and projection models, the output and purposes are very different.
What are Normal Curve Equivalents? Are they the same thing as percentiles?
Normal Curve Equivalents (NCEs) provide a common scale when comparing different tests and test versions. In essence, test scale scores are translated to exiting NCEs, which enable comparison of the achievement levels of groups of students from year to year. An NCE of 50 is the in the state average attainment level of students within a grade/subject/year.
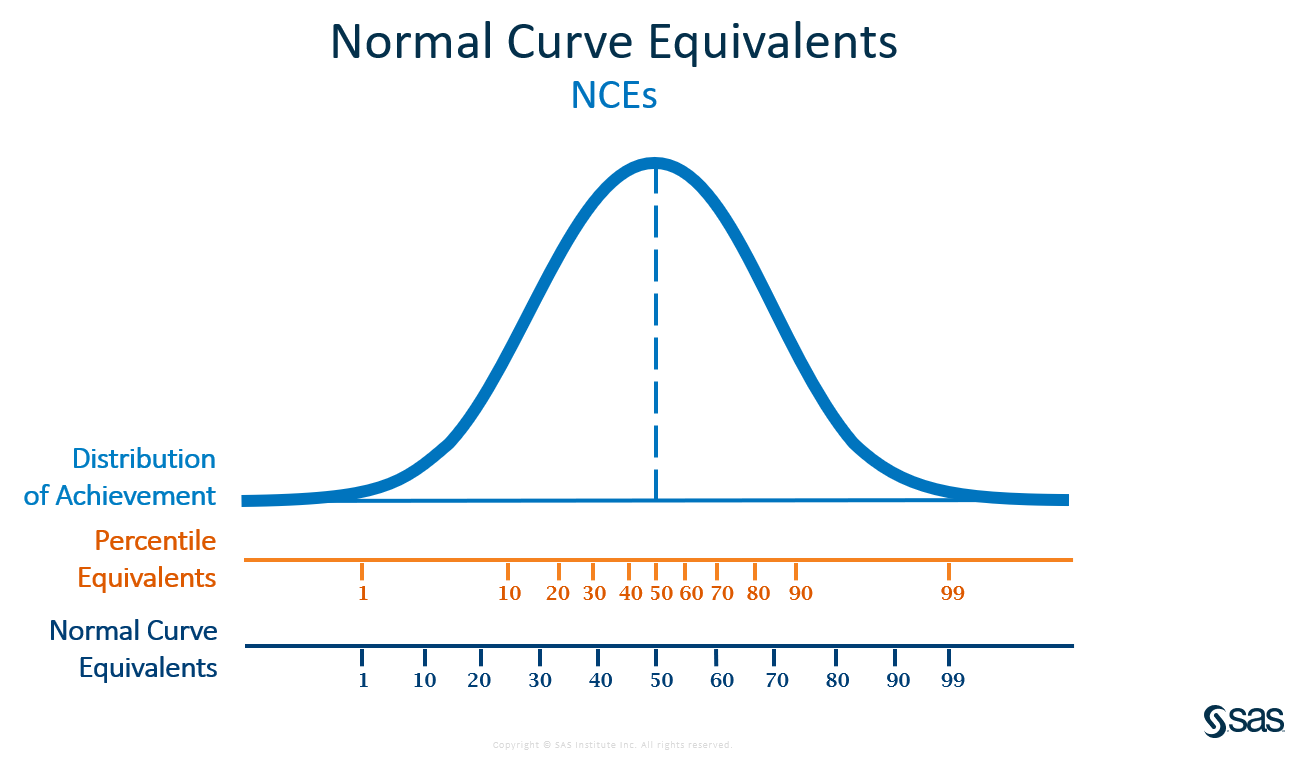
NCEs and percentiles are not the same thing however. A student might score at the 80th percentile for an end-of-grade assessment, but their score represents an NCE of 67.
Percentiles are frequency based. In other words, they are determined by how many students scored at each point in the distribution. As a result, they are not evenly spaced. In a typical normal distribution, the percentiles are very close together in the middle and farther apart at the tails. Why? Because many students score about average while few students earn the lowest or highest score on the assessment.
In contrast, NCEs are equal interval. The distance between the 10th and 20th NCEs is the same as the distance between the 50th and 60th. As a result, NCEs can be averaged, and it is possible to measure the progress of groups of students as they move in the distribution.
Converting scores to NCEs also helps ensure value-added reporting can still be provided when assessments change. When NCEs are used, the analysis measures changes in achievement in NCEs rather than scale scores. The students in a school simply need to maintain their achievement level relative to the state distribution to meet Expected Growth.
Why does a school or teacher not have a report for a particular subject?
To receive a report, a district, school, or teacher must have a minimum of seven students who have sufficient data to be included in the analyses. For teachers who had partial instructional responsibility for students, the total instructional responsibility for all students combined must be equivalent to at least five effective students. For example, if a teacher had 50% instructional responsibility for 10 students, the total instructional responsibility would be the equivalent of only five students. As a result, the teacher would not receive a report. More details are available in the next question regarding teachers' instructional responsibility.
Who decides which students' scores a teacher is responsible for?
Each year, districts submit data through the Michigan Data Hub (MiDataHub). EVAAS uses the data to link students to teachers. Note that teachers will only receive a growth measure if sufficient data exists for each individual teacher regarding the number of students with a valid test score, prior test scores, and total percentage of instructional responsibility across all students linked to the teacher. Details about the current Michigan Department of Education business rules are available on the Michigan EVAAS log in page within the Statistical Models and Business Rules document. The student list under the individual teacher report provides a list of students submitted as well as whether a student was included or excluded from the report.
How can districts receive Teacher Reports?
If your district would like to receive valuable teacher reporting for future releases in addition to the standard reports, your district will need to provide student-teacher linkages through the MiDataHub.
More information about the steps needed to complete the opt-in process is available from MiDataHub. Schools opting in will need to ensure that data has been published to MiDataHub, which will include teacher linkages to classes as well as any other prior data available. MiDataHub has more information about Data Hub Requirements.
Submitting these student-teacher linkages allows SAS to provide individual teacher reporting to your district. This reporting includes diagnostic information as well as useful, reliable measures of the academic growth that a teacher's students made, on average, in the selected grade and subject or course. This data can help educators reflect on past practices and proactively plan for current and future classes. In addition, school user accounts will be created for all teachers receiving reports based on information from the MiDataHub.