- Measuring Growth
- Reports
- Additional Resources
- Admin Help
- General Help
School Diagnostic | 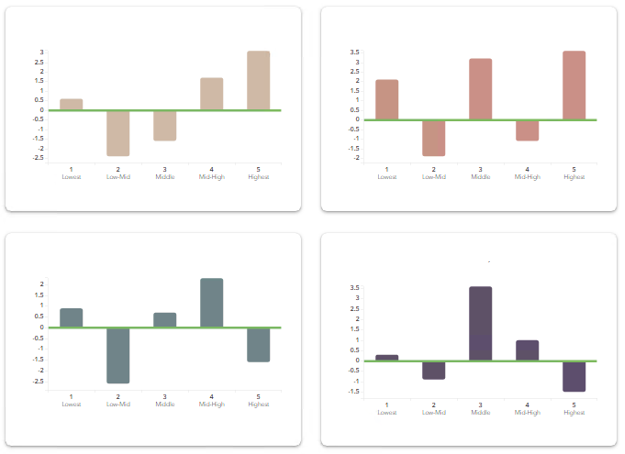 |
Technical Details
Placing Students into Achievement Groups
Students are placed into five groups based on their achievement.
When the graph shows five groups, the lowest group includes students whose achievement falls into the lowest 20% of the state distribution, the low-mid group includes students whose achievement falls between the 20th and 40th percentiles, and so on.
When the graph shows three groups, the lowest group includes students whose achievement falls into the lowest third of the state distribution, the low-mid group includes students whose achievement falls in the middle third, and the highest group includes students whose achievement is in the top third.
For all assessments, more than a single test score is used to place students into groups. Using more data minimizes the effect of measurement error and helps ensure that students are placed into achievement groups appropriately.
Students are divided into five equal groups based on where their achievement in the selected subject falls in the state distribution.
For all assessments, more than a single test score is used to place students into groups. Using more data minimizes the effect of measurement error and helps ensure that students are placed into achievement groups appropriately.
The model used to analyze the selected assessment determines how we define achievement. See assessments analyzed with the gain model and assessments analyzed with the predictive model.
| Model | How Achievement is Defined |
| Gain Model | The average of a student's two most recent scores in the selected subject. For example, in a report for sixth-grade math, students are placed into achievement groups based on the average of their fifth-grade and sixth-grade math scores. If a student's fifth-grade math score is missing, that student is not placed into an achievement group on this report. |
| Predictive Model | Where the student's expected score falls in the state distribution for that grade and subject or course. Students who lack sufficient data do not have expected scores and therefore are not included in achievement groups on this report. For all tests, students must have three prior assessment scores across grades and subjects to have expected scores. |
School Performance Diagnostic
Students are placed into five groups based on where their expected scores fall relative to the performance level ranges that are defined by the state. Entering achievement reflects students' achievement before the current school year or when they entered a grade and subject or course. This method of placing students is used for all state assessments, regardless of whether the data is analyzed with the gain model or the predictive model.
A student must have three prior scores across grades and subjects for an expected score to be generated. If a student has fewer than three prior scores, no expected score will be generated, and the student will not be included in this report.
Teacher Custom Diagnostic
Students are placed into three equal groups based on where each student's achievement falls in the distribution of students that you selected. The Low group includes the students whose achievement falls into the lowest third of students you selected. The High group includes the students whose achievement falls into the highest third of students you selected.
Generating Growth Measures
Once students are placed into groups, a simple growth measure is generated for each group. A group must have at least five students for a growth measure to be generated.
For all assessments, a growth measure of 0.0 represents meeting expected growth.
It's important to remember that these simple growth measures do not come from the robust analytic models that generate the growth measures on the value-added reports. As a result, you'll want to exercise some caution when interpreting the data. Specifically, focus on the relative pattern of growth across groups rather than rely too heavily on any one value. Because the growth measures are estimates, consider their associated standard errors as you interpret the values.
The model used to analyze the selected assessment determines how we generate growth measures. See assessments analyzed with the gain model and assessments analyzed with the predictive model.
| Model | How Growth Measures are Generated |
| Gain Model | The growth measure is the difference between the group's two most recent scores in the selected subject. Specifically, the growth measure is the difference between the group's average score in the selected subject in the most recent year and their average score in the same subject the previous year. The growth measures for these assessments are expressed in state NCEs. Differences in student counts within each year can cause slight shifts in the NCEs for prior years. For more information see Why Students' NCEs Might Change. |
| Predictive Model | The growth measure is the difference between the group's average score and their average expected score in the selected subject or course. The growth measures for these assessments are expressed in scale score points. |